
Earnings Read: Understand a Company's Earnings in Minutes
Go beyond whether a company beat or missed expectations. Analyze quarterly revenue, earnings, margins (when available), growth, and the financial trends that matter, with structured research that helps you understand what changed.
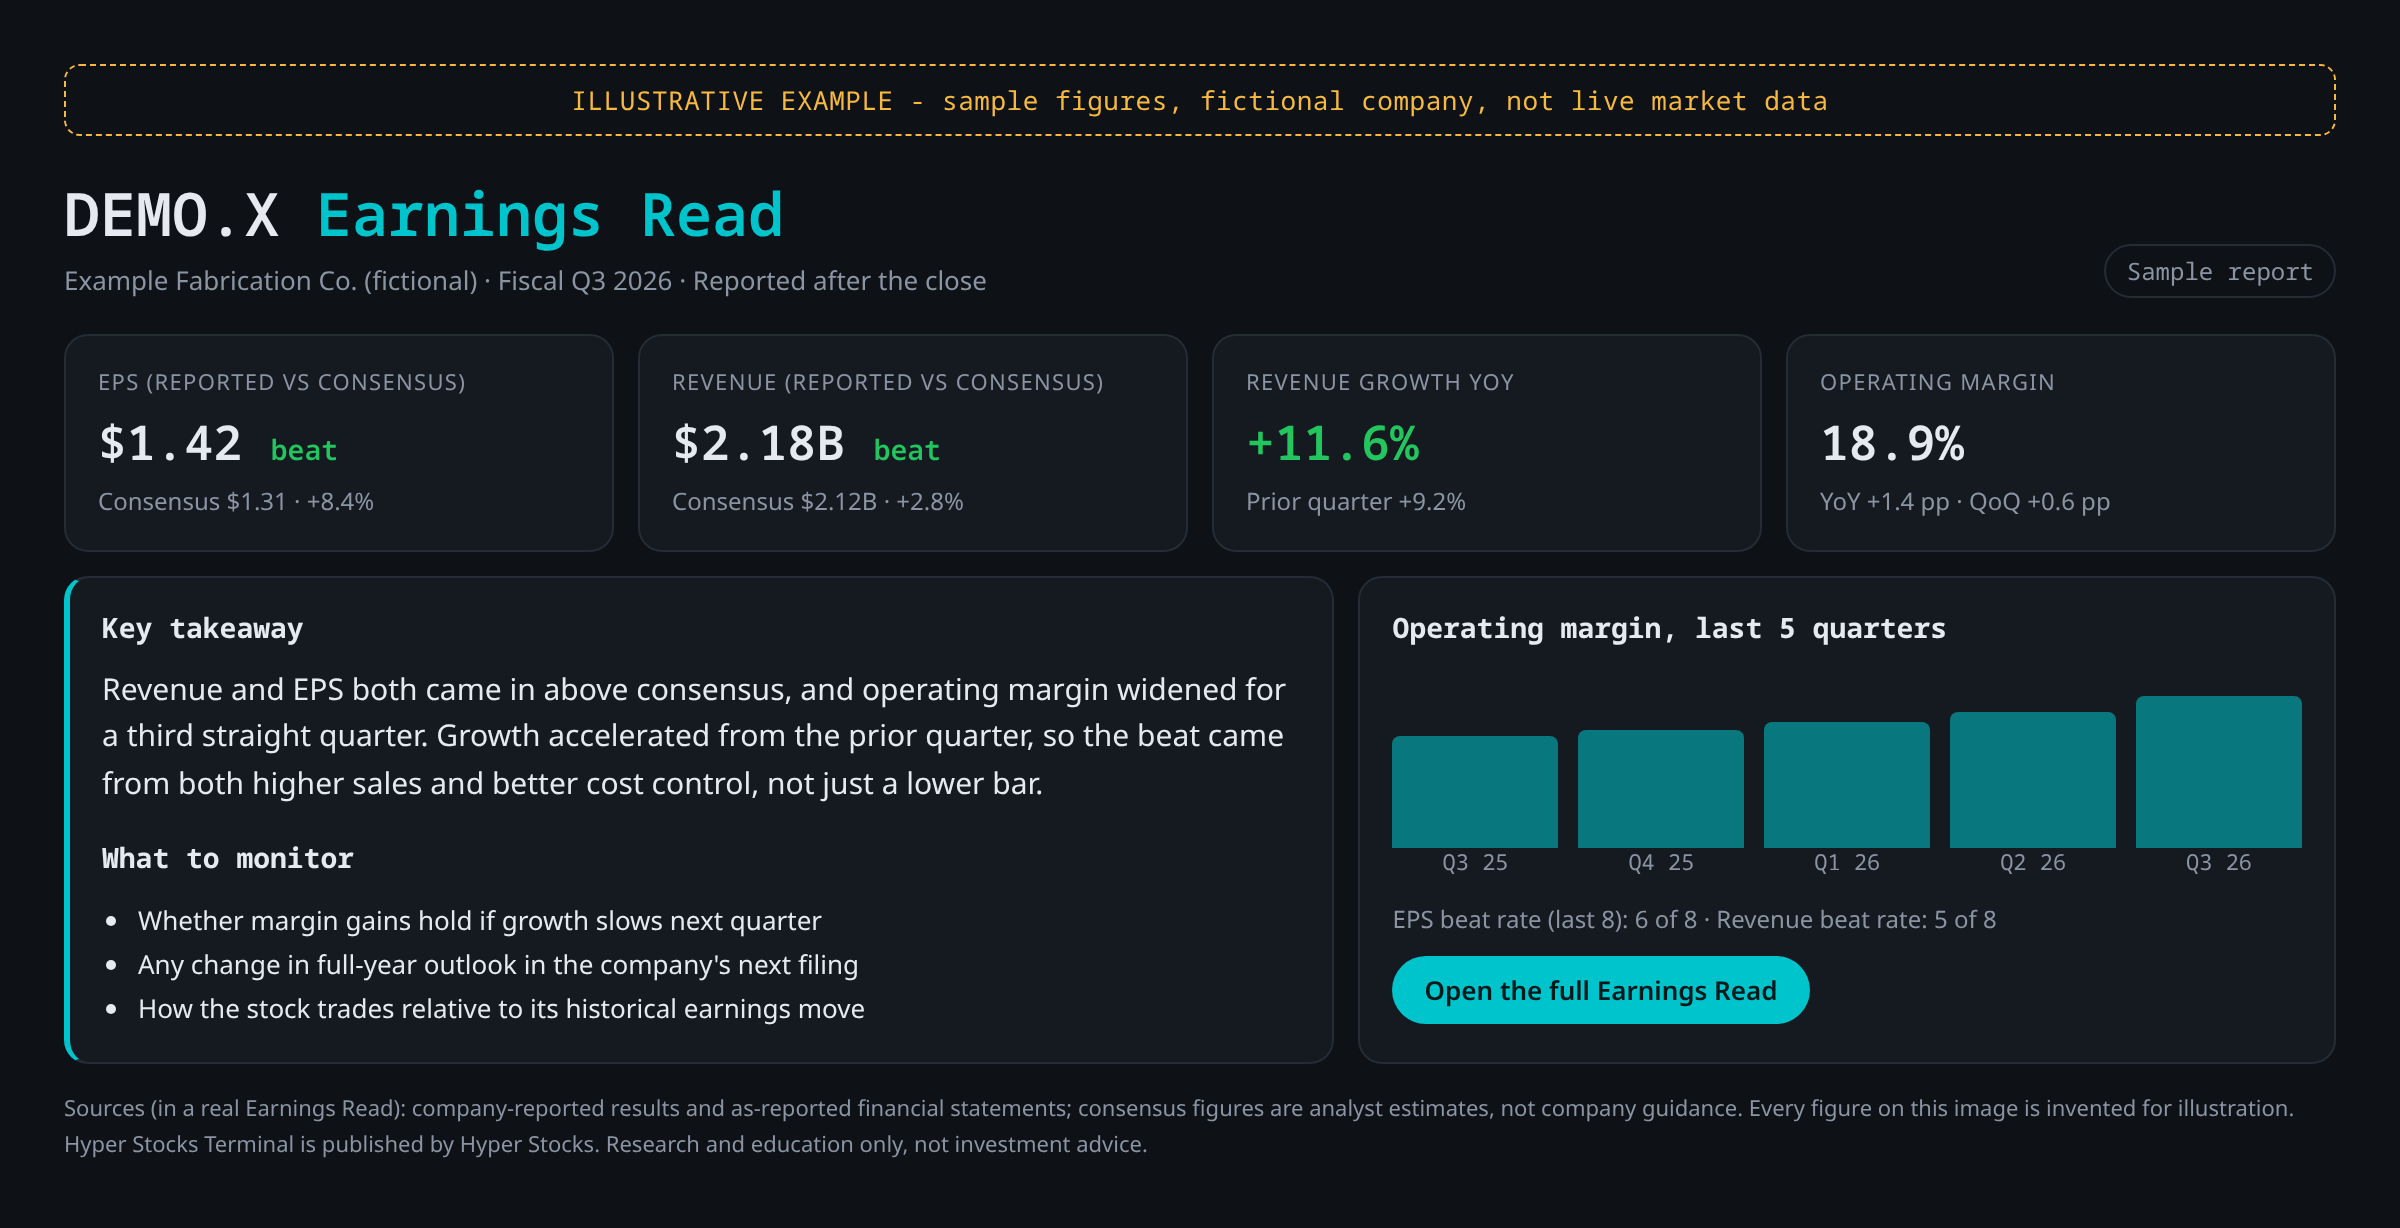
What an Earnings Read shows
- Reported EPS and revenue next to analyst consensus, with beat or miss.
- Revenue growth compared with the same quarter a year earlier.
- Gross and operating margin with year-over-year and quarter-over-quarter change, when the company's as-reported financial statements are available. If they are not available yet, the read says so instead of estimating them.
- How the stock traded around the report, compared with its own earnings history.
- A short list of what to monitor next.
Where the numbers come from
Reported figures come from company results and as-reported financial statements. Consensus figures are analyst estimates, not company guidance. Each read shows the report date and session, and data timestamps where available.
Earnings Read is a data-driven, AI-assisted readout. It is different from the human-written research in Hyper Stocks Research, which is written and dated by named authors. See the methodology for data sources.
Free and Pro access
- Free account: 2 distinct Earnings Reads per week. The week resets Monday at 12:00 AM New York time. Reopening a report you already unlocked that week does not use another read.
- Hyper Stocks Pro: full access to every reporting company, including the AI write-up. Eligible new members get a 7-day free trial.
Compare plans on the pricing page.
Limits
Earnings Read is research and education, not investment advice. Coverage depends on available data, and some metrics are missing for some companies. Hyper Stocks Terminal and Earnings Read are products owned and published by Hyper Stocks.
Where to go next
Find upcoming reports on the earnings calendar, or browse the earnings hub.